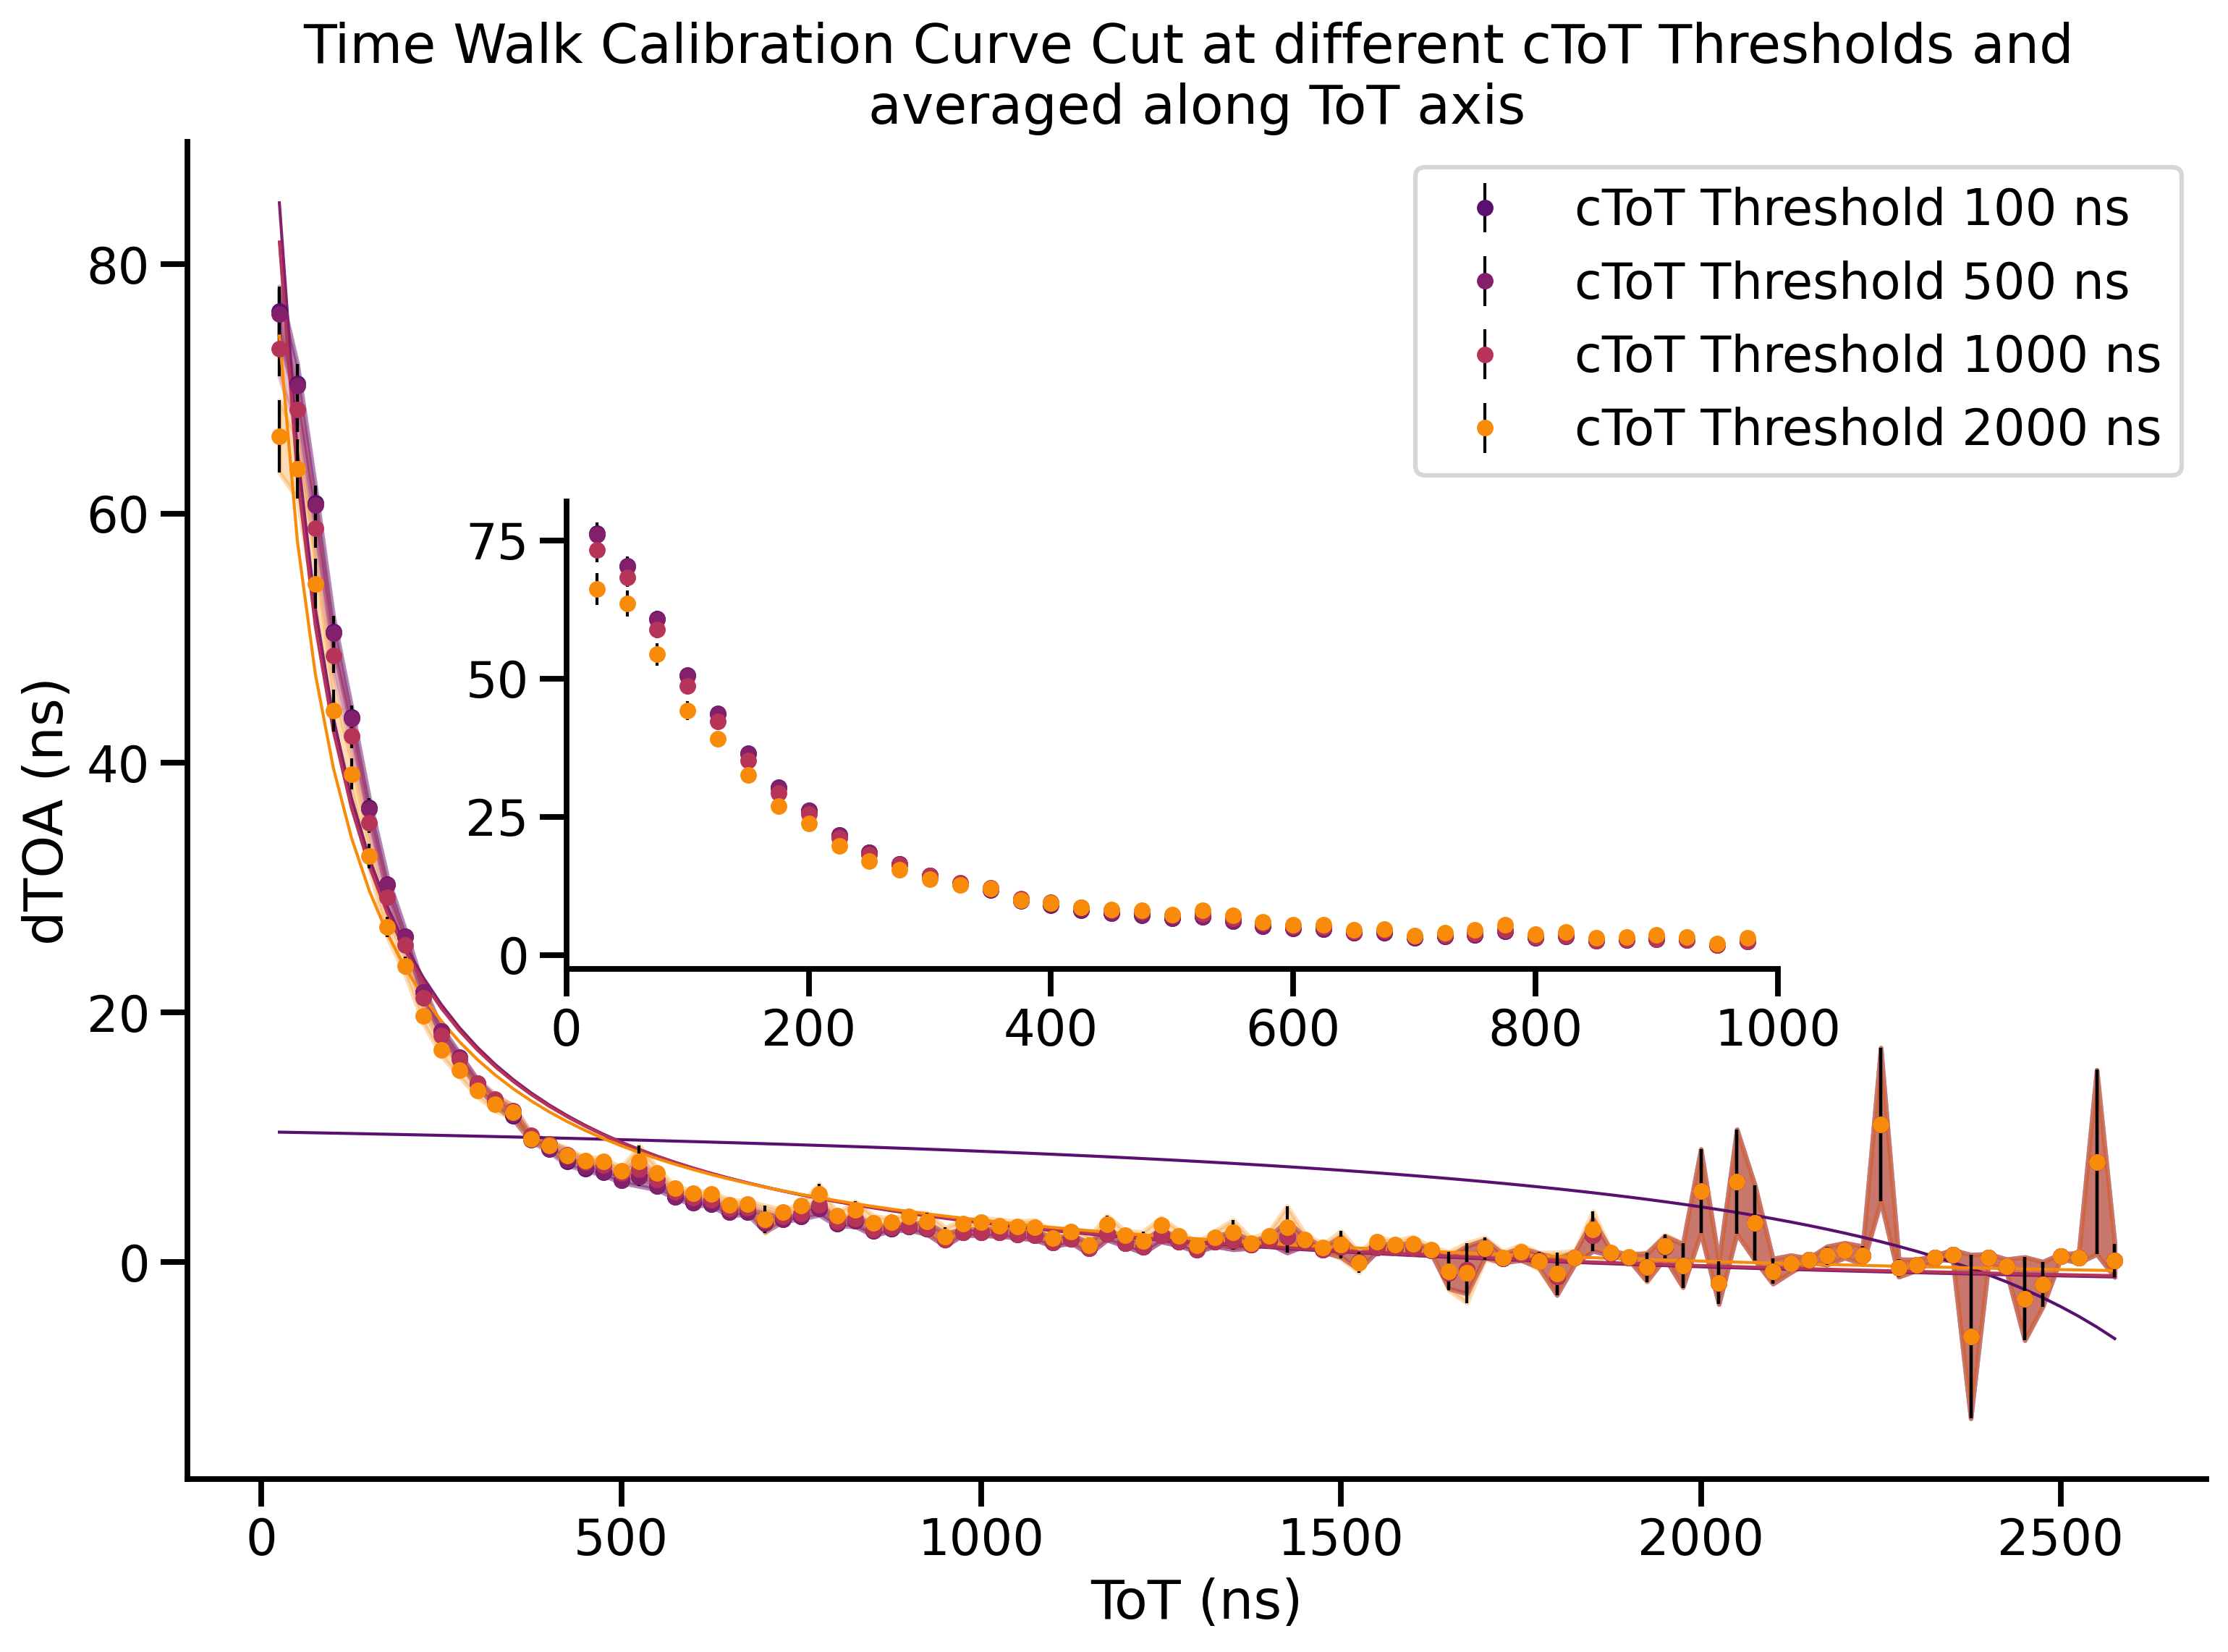
Time-walk Correction: Constructing LUT
While luna does this for you when you choose the ctot-cut parameter you may also compute the lookup table yourself. The method is basically computing averages of each ToT value for each cToT above a certain threshold. This threshold is the ctot-cut parameter.
In this example we also fit the lookup table to an equation that models the shape of the curve.
Note
Parameter fitting can be unstable. It is also fine to the use values as-is, without curve fitting.
Luna Command
./tpx3dump process -i /Users/Ciaran/atlassian-bitbucket-pipelines-runner/temp/e71169e4-520a-5b30-a5ab-ee8a44eb5fac/build/docs/source/_static/example_data.tpx3 -o /Users/Ciaran/atlassian-bitbucket-pipelines-runner/temp/e71169e4-520a-5b30-a5ab-ee8a44eb5fac/build/docs/source/_static/example_data.h5 --eps-t 170ns --eps-s 1 --calculate-timewalk-statistics --layout single
Python Script
Creating a lookup table from the Timewalk Matrix
  1import os, sys
  2from typing import *
  3import lmfit
  4import pandas as pd  # ensure you have `pip install pandas`
  5import warnings
  6import seaborn as sns
  7import matplotlib.pyplot as plt
  8from matplotlib import cm
  9from matplotlib.colors import Normalize
 10import numpy as np
 11from mpl_toolkits.axes_grid1.inset_locator import inset_axes
 12
 13warnings.filterwarnings("ignore")  # suppress warnings from plotting libraries.
 14
 15sns.set_context(context="talk")
 16
 17# add some paths to PYTHONPATH
 18for directory in ["..", "."]:
 19    sys.path.append(os.path.abspath(os.path.join(os.path.dirname(__file__), directory)))
 20
 21# on our system "EXAMPLE_DATA_HDF5" refers to the absolute path
 22# to a hdf5 file generated by luna. Replace with your own!
 23from env_vars_for_docs_examples import EXAMPLE_DATA_HDF5, PLOTS_DIRECTORY
 24
 25# re-use functions from previous example
 26from ex2_read_data_time_units import load_timewalk_matrix, TimeUnit
 27
 28
 29def toa_calibration_equation(x, b, c, d):
 30    # return b + (c / (x - d + 1e-6))
 31    return b + (c / (x - d))
 32
 33
 34def resid(params, x, y_data):
 35    b = params['b'].value
 36    c = params['c'].value
 37    d = params['d'].value
 38    y_model = toa_calibration_equation(x, b, c, d)
 39    return y_model - y_data
 40
 41
 42def fit_calibration_curve(x_data, y_data, y_data_weights=None):
 43    params = lmfit.Parameters()
 44    params.add('b', value=y_data[0], vary=True, min=-1e4, max=1e4)
 45    params.add('c', value=1, vary=True, min=-1e4, max=1e4)
 46    params.add('d', value=10, vary=True, min=-1e4, max=1e4)
 47
 48    model = lmfit.Model(toa_calibration_equation)
 49    result = model.fit(data=y_data, params=params, x=x_data, weights=y_data_weights)
 50
 51    return result
 52
 53
 54def compute_calibration_curve_data(timewalk_matrix: pd.DataFrame, cToT_thresholds: List[int]):
 55    """"""
 56    print(timewalk_matrix.head(5).to_string())
 57    fitted_parameters_dct = {}
 58    stats_data_dct = {}
 59    fit_results_series = []
 60    for ctot_threshold in cToT_thresholds:
 61        print(f"Calculating calibration curve for ctot_threshold={ctot_threshold}")
 62        # print(timewalk_matrix.head(5).to_string())
 63        data_subset_df = timewalk_matrix[timewalk_matrix["CToT"] >= ctot_threshold]
 64        stats_df = data_subset_df.groupby("ToT").agg(["mean", "std", "sem", "count"])["AverageDToA"]
 65        stats_df = stats_df[stats_df['count'] >= 10]
 66        stats_data_dct[ctot_threshold] = stats_df
 67        x_data = stats_df.index.values
 68        y_data = stats_df["mean"].values
 69        fit_result = fit_calibration_curve(x_data=x_data, y_data=y_data, y_data_weights=None)
 70        fit_results_series.append(pd.Series(fit_result, index=[ctot_threshold]))
 71
 72        fitted_parameters_dct[ctot_threshold] = fit_result.values
 73    fitted_parameters = pd.DataFrame.from_dict(fitted_parameters_dct)
 74    fit_result_df = pd.concat(fit_results_series)
 75    stats_data = pd.concat(stats_data_dct)
 76    stats_data.index.names = ["ctot_threshold", "ToT"]
 77    return fitted_parameters, stats_data, fit_result_df
 78
 79
 80def plot_calibration_curve(stats_data: pd.DataFrame, fit_result: pd.DataFrame):
 81    # Create a colormap for shades of green
 82    cmap = cm.inferno
 83    # Normalize the colormap based on the cToT_thresholds
 84    cToT_thresholds = list(set(stats_data.index.get_level_values(0)))
 85    colours_normed = Normalize(vmin=min(cToT_thresholds) - 1000, vmax=max(cToT_thresholds) + 1000)
 86
 87    # Create the plot
 88    fig, ax = plt.subplots(figsize=(12, 8))
 89    sns.despine(fig=fig)
 90
 91    for ctot_threshold, df in stats_data.groupby(by="ctot_threshold"):
 92        color = cmap(colours_normed(ctot_threshold))
 93        # Plot the experimental data
 94        x_data = stats_data.loc[ctot_threshold].index.values
 95        y_data_experimental = stats_data.loc[ctot_threshold, "mean"]
 96        y_err = stats_data.loc[ctot_threshold, "sem"]
 97        y_data_fitted = fit_result[ctot_threshold].best_fit
 98        ax.fill_between(x_data, y_data_experimental - y_err, y_data_experimental + y_err, color=color, alpha=0.3)
 99        # Plot markers and fitted line
100        ax.plot(x_data, y_data_fitted, color=color, linewidth=1)
101
102        ax.errorbar(x_data, y_data_experimental, yerr=y_err, label=f'cToT Threshold {ctot_threshold} ns', marker=".",
103                    color=color, linestyle="None", elinewidth=1, ecolor="black")
104
105    # Add title and labels
106    ax.set_title('Time Walk Calibration Curve Cut at different cToT Thresholds and \naveraged along ToT axis')
107    ax.set_xlabel('ToT (ns)')
108    ax.set_ylabel('dTOA (ns)')
109    ax.legend(loc='upper right', bbox_to_anchor=(1.0, 1.0))
110
111    # Create an inset Axes instance at a given position with a given size
112    # The first two arguments are the lower left corner position of the inset axes in the parent axes
113    # The next two arguments are the width and height of the inset axes
114    # bbox_to_anchor can be used to position the inset relative to the parent axes
115    ax_inset = inset_axes(ax, width="60%", height="70%", loc='upper right', bbox_to_anchor=(-0.2, 0.25, 1.0, 0.5),
116                          bbox_transform=ax.transAxes)
117    sns.despine(ax=ax_inset)
118
119    # Plot the same data on the inset but for the x-axis from 0 to 1000
120    for ctot_threshold, df in stats_data.groupby(by="ctot_threshold"):
121        color = cmap(colours_normed(ctot_threshold))
122        x_data = df.index.get_level_values(1)  # Or your specific way to get x_data
123        y_data_experimental = df["mean"]
124        y_data_err = df["sem"]
125        y_data_fitted = fit_result[ctot_threshold].best_fit
126
127        # Filter data for x_data < 1000
128        mask = x_data < 1000
129        x_data_inset = x_data[mask]
130        y_data_experimental_inset = y_data_experimental[mask]
131        y_data_fitted_inset = y_data_fitted[mask]
132        y_err_inset = y_data_err[mask]
133
134        # ax_inset.plot(x_data_inset, y_data_experimental_inset, marker=".", color=color, linestyle="None", alpha=0.7)
135        ax_inset.errorbar(x_data_inset, y_data_experimental_inset, yerr=y_err_inset,
136                          label=f'cToT Threshold {ctot_threshold} ns', marker=".",
137                          color=color, linestyle="None", elinewidth=1, ecolor="black")
138
139    # Set the inset's x-axis limit
140    ax_inset.set_xlim(0, 1000)
141
142    fname = os.path.join(PLOTS_DIRECTORY, f"ex9_timewalk_lut_construction.png")
143    plt.savefig(fname, dpi=300, bbox_inches='tight')
144
145
146if __name__ == "__main__":
147    toa_unit = TimeUnit.Nanoseconds
148
149
150    timewalk_matrix = load_timewalk_matrix(EXAMPLE_DATA_HDF5, toa_unit=toa_unit)
151
152    if timewalk_matrix is not None:
153        tot_thresholds = [100, 500, 1000, 2000]
154        params, data, fit_result = compute_calibration_curve_data(timewalk_matrix, tot_thresholds)
155        plot_calibration_curve(data, fit_result)
Script Output
Example Output
<KeysViewHDF5 ['Clusters', 'ExposureTimeBoundaries', 'PixelHits', 'TimewalkLookupTable', 'TimewalkMatrix']>
   CToT  ToT  AverageDToA  SumSquareDiff  Count        Std       Sem
0   450   25    96.223969     53196212.0     12  21.054733  6.077978
1   450   50    83.750008    119628920.0     25  21.875000  4.375000
2   450   75    76.627617     66283176.0     24  16.618660  3.392270
3   450  100    62.467461     91039528.0     48  13.771915  1.987805
4   450  125    51.258690    118634712.0     72  12.836293  1.512772
Calculating calibration curve for ctot_threshold=100
Calculating calibration curve for ctot_threshold=500
Calculating calibration curve for ctot_threshold=1000
Calculating calibration curve for ctot_threshold=2000
