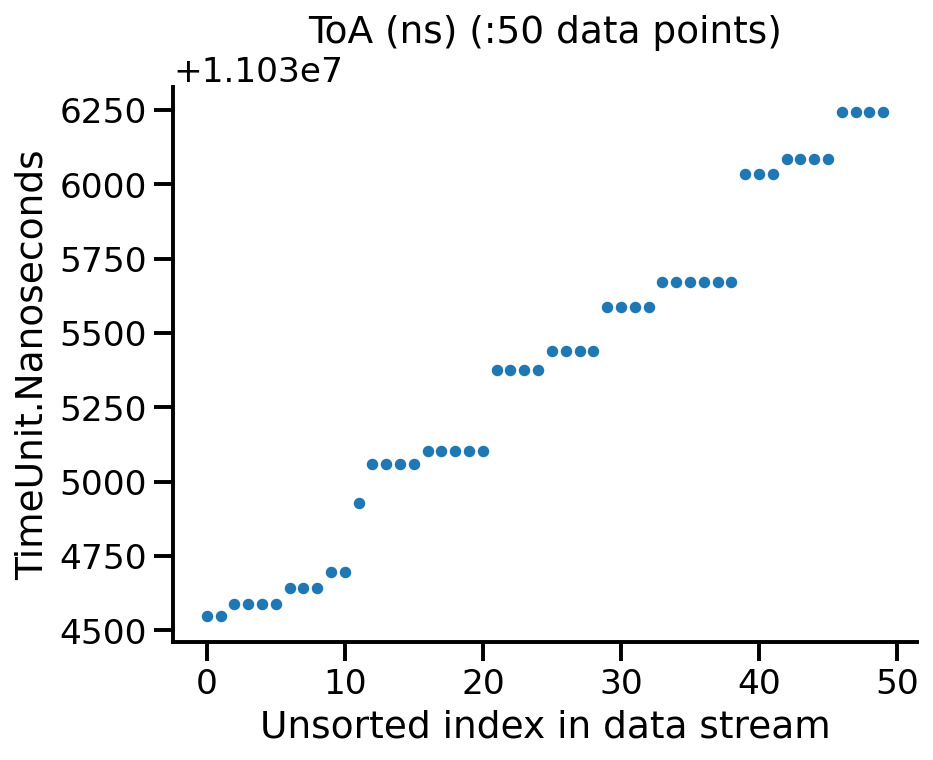
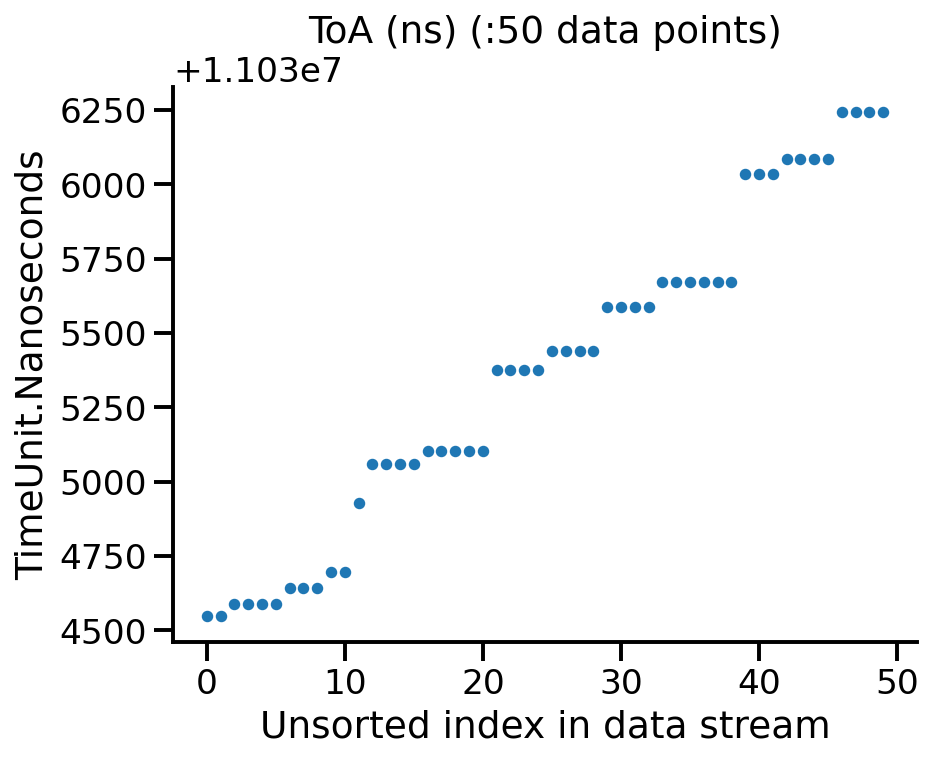
Apply the timewalk correction
We first must have run tpx3dump process command on a dataset with the appropriate options
to enable the calculation of the timewalk statistics. Afterwards we can run the tpx3dump apply-timewalk-corrrection
subcommand
Luna Command
./tpx3dump process --input-files /Users/Ciaran/atlassian-bitbucket-pipelines-runner/temp/e71169e4-520a-5b30-a5ab-ee8a44eb5fac/build/docs/source/_static/example_data.tpx3 --layout single --clustering-algorithm Kuttruff2024 --eps-t 170ns --eps-s 6 --kuttruff-buffer-size 15 --calculate-timewalk-statistics --output-file /Users/Ciaran/atlassian-bitbucket-pipelines-runner/temp/e71169e4-520a-5b30-a5ab-ee8a44eb5fac/build/docs/source/_static/example_data.h5
./tpx3dump apply-timewalk-correction --timewalk-file /Users/Ciaran/atlassian-bitbucket-pipelines-runner/temp/e71169e4-520a-5b30-a5ab-ee8a44eb5fac/build/docs/source/_static/example_data.h5 --output-file /Users/Ciaran/atlassian-bitbucket-pipelines-runner/temp/e71169e4-520a-5b30-a5ab-ee8a44eb5fac/build/docs/source/_static/example_data2.h5 --ctot-cut 450
Python Script
Applying the timewalk correction to a dataset
 1import os, sys
 2import h5py  # ensure you have `pip install h5py`
 3import pandas as pd  # ensure you have `pip install pandas`
 4from typing import *
 5import matplotlib.pyplot as plt
 6import seaborn as sns
 7import warnings
 8
 9warnings.filterwarnings("ignore")  # suppress warnings from plotting libraries.
10
11sns.set_context(context="talk")
12
13# add some paths to PYTHONPATH
14for directory in ["..", "."]:
15    sys.path.append(os.path.abspath(os.path.join(os.path.dirname(__file__), directory)))
16
17# on our system "EXAMPLE_DATA_HDF5" refers to the absolute path
18# to a hdf5 file generated by luna. Replace with your own!
19from env_vars_for_docs_examples import EXAMPLE_DATA_HDF5, EXAMPLE2_DATA_HDF5, PLOTS_DIRECTORY
20
21# re-use functions from previous example
22from ex2_read_data_time_units import TimeUnit, load_pixel_hits
23from ex11_raw_only_analysis import plot_toa
24
25TOA_UNIT = TimeUnit.Microseconds
26
27
28if __name__ == "__main__":
29
30    toa_before_correction_fname = os.path.join(PLOTS_DIRECTORY, f"ex14_apply_timewalk_correction_toa_before_correction.png")
31    toa_after_correction_fname = os.path.join(PLOTS_DIRECTORY, f"ex14_apply_timewalk_correction_toa_after_correction.png")
32
33    pixel_hits_before_correction: pd.DataFrame = load_pixel_hits(EXAMPLE_DATA_HDF5, toa_unit=TimeUnit.Microseconds)
34    pixel_hits_after_correction: pd.DataFrame = load_pixel_hits(EXAMPLE2_DATA_HDF5, toa_unit=TimeUnit.Microseconds)
35
36    start = 0
37    stop = 50
38    plot_toa(pixel_hits_before_correction, start=start, stop=stop, fname=toa_before_correction_fname, time_units=TOA_UNIT)
39    plot_toa(pixel_hits_after_correction, start=start, stop=stop, fname=toa_after_correction_fname, time_units=TOA_UNIT)
40
41    diff = pixel_hits_before_correction["toa"] - pixel_hits_after_correction["toa"]
42    print(diff.head(50).to_string())
43
Script Output
Example Output
hdf5 datasets: ['Clusters', 'ExposureTimeBoundaries', 'PixelHits', 'TimewalkLookupTable', 'TimewalkMatrix']
hdf5 datasets: ['Clusters', 'ExposureTimeBoundaries', 'PixelHits', 'TimewalkLookupTable', 'TimewalkMatrix']
Plot saved to "/Users/Ciaran/atlassian-bitbucket-pipelines-runner/temp/e71169e4-520a-5b30-a5ab-ee8a44eb5fac/build/docs/source/_static/examples_output/plots/ex14_apply_timewalk_correction_toa_before_correction.png"
Plot saved to "/Users/Ciaran/atlassian-bitbucket-pipelines-runner/temp/e71169e4-520a-5b30-a5ab-ee8a44eb5fac/build/docs/source/_static/examples_output/plots/ex14_apply_timewalk_correction_toa_after_correction.png"
0      0.004095
1      0.000000
2      0.000000
3      0.000000
4      0.217935
5      0.000000
6      1.047299
7      0.000000
8      0.000000
9      0.165562
10     0.165562
11     0.165562
12    11.188034
13     0.000000
14     0.000000
15     0.000000
16     0.000000
17     0.000000
18     0.000000
19     0.017495
20     0.004095
21     0.453426
22     0.165562
23     0.000000
24     0.035683
25     0.000000
26     0.159905
27     0.084773
28     0.000000
29     0.000000
30     0.995096
31     0.158259
32     0.000000
33     0.000000
34     0.000000
35     0.217935
36     0.000000
37     0.217935
38     0.000000
39     0.000000
40     0.013170
41     0.000000
42     0.000000
43     2.370532
44     0.995096
45     0.995096
46     5.371407
47     0.000000
48     0.035683
49     0.000000

|

|