Raw only Analysis
We can generate raw output which omits any sorting and clustering, for if you want to take a quick look at the raw data.
Luna Command
./tpx3dump process -i /Users/Ciaran/atlassian-bitbucket-pipelines-runner/temp/e71169e4-520a-5b30-a5ab-ee8a44eb5fac/build/docs/source/_static/example_data.tpx3 -o /Users/Ciaran/atlassian-bitbucket-pipelines-runner/temp/e71169e4-520a-5b30-a5ab-ee8a44eb5fac/build/docs/source/_static/example_data.h5 --raw-only --layout single
Python Script
- noindex:
Raw only processing
1import os, sys
2import h5py # ensure you have `pip install h5py`
3import pandas as pd # ensure you have `pip install pandas`
4from typing import *
5import matplotlib.pyplot as plt
6import seaborn as sns
7import warnings
8
9warnings.filterwarnings("ignore") # suppress warnings from plotting libraries.
10
11sns.set_context(context="talk")
12
13# add some paths to PYTHONPATH
14for directory in ["..", "."]:
15 sys.path.append(os.path.abspath(os.path.join(os.path.dirname(__file__), directory)))
16
17# on our system "EXAMPLE_DATA_HDF5" refers to the absolute path
18# to a hdf5 file generated by luna. Replace with your own!
19from env_vars_for_docs_examples import EXAMPLE_DATA_HDF5, PLOTS_DIRECTORY
20
21# re-use functions from previous example
22from ex2_read_data_time_units import TimeUnit, load_pixel_hits
23
24TOA_UNIT = TimeUnit.Nanoseconds
25
26
27def plot_toa(pixel_data: pd.DataFrame, start: int = 0, stop: int = -1, fname=None, time_units: TimeUnit = TimeUnit.Nanoseconds):
28 fig = plt.figure()
29 plt.plot(pixel_data["toa"].iloc[start: stop], marker=".", linestyle='none')
30
31 plt.title(f"ToA (ns) ({start if start != 0 else ''}:{stop if stop!= '-1' else ''} data points)")
32 plt.ylabel(f"{time_units}")
33 plt.xlabel("Unsorted index in data stream")
34 sns.despine(fig)
35 if fname is None:
36 fname = os.path.join(PLOTS_DIRECTORY, f"ex11_toa_{start}-{stop}.png")
37 plt.savefig(fname, dpi=150, bbox_inches="tight")
38 print("Plot saved to \"{}\"".format(fname))
39
40
41if __name__ == "__main__":
42 pixel_hits = load_pixel_hits(EXAMPLE_DATA_HDF5, TOA_UNIT)
43 print(pixel_hits.head().to_string())
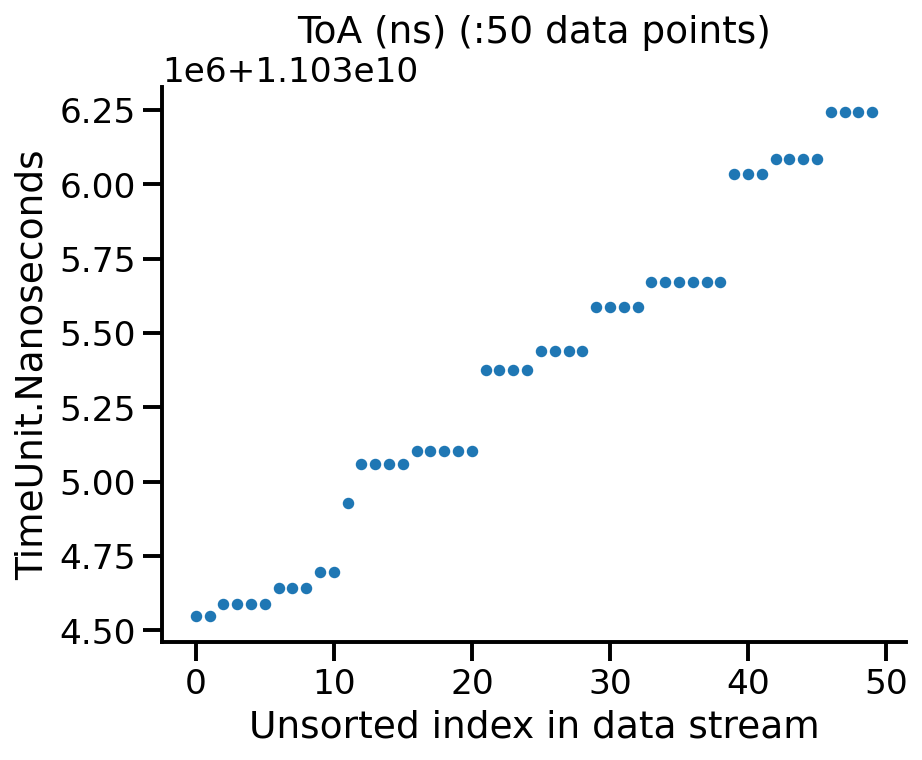
44 plot_toa(pixel_hits, start=0, stop=50)
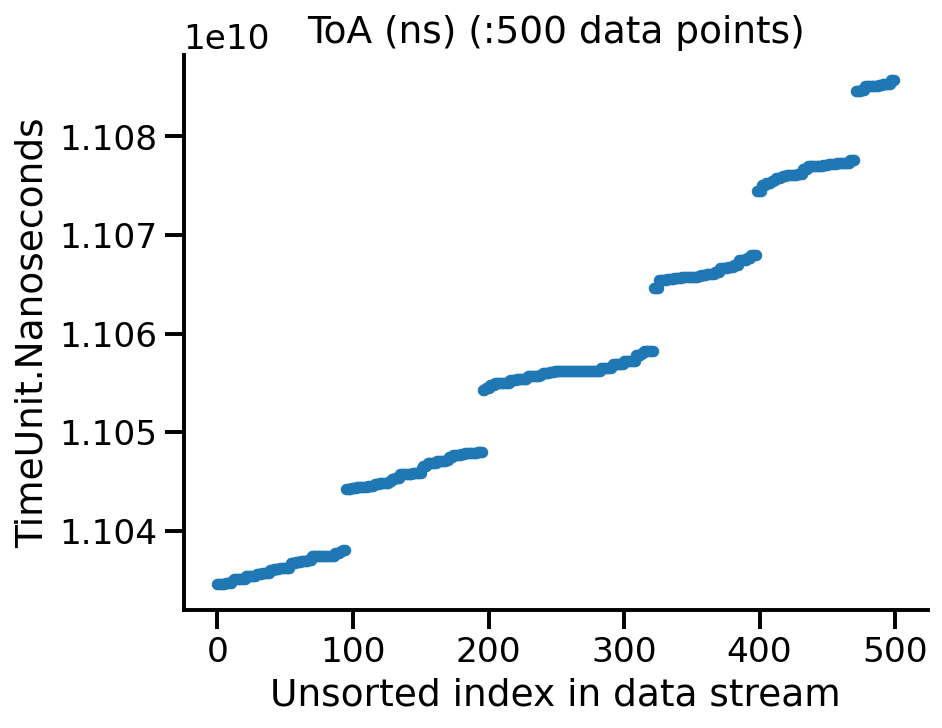
45 plot_toa(pixel_hits, start=0, stop=500)
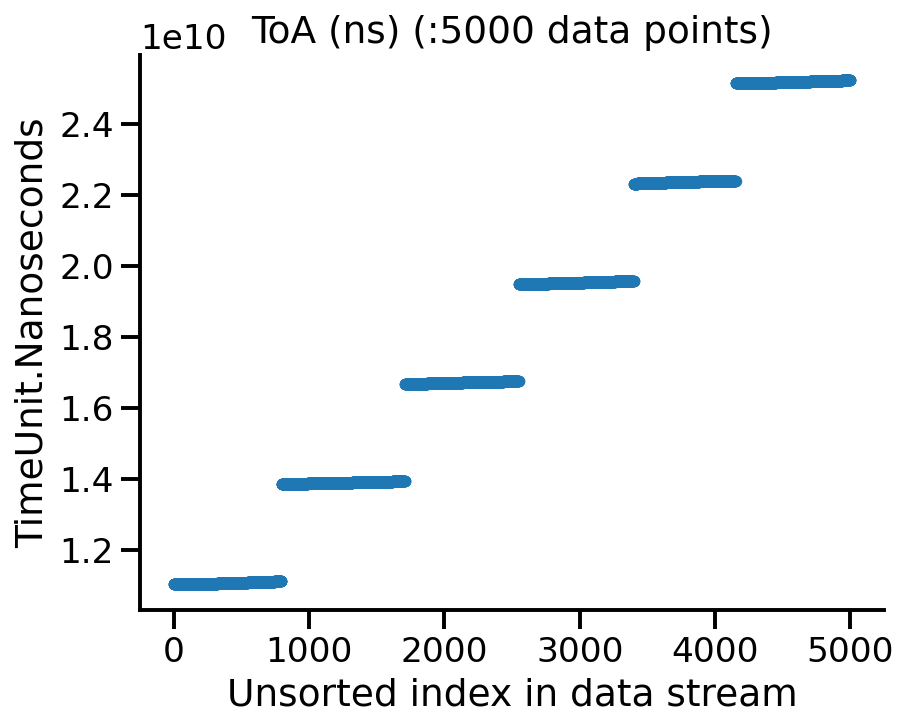
46 plot_toa(pixel_hits, start=0, stop=5000)
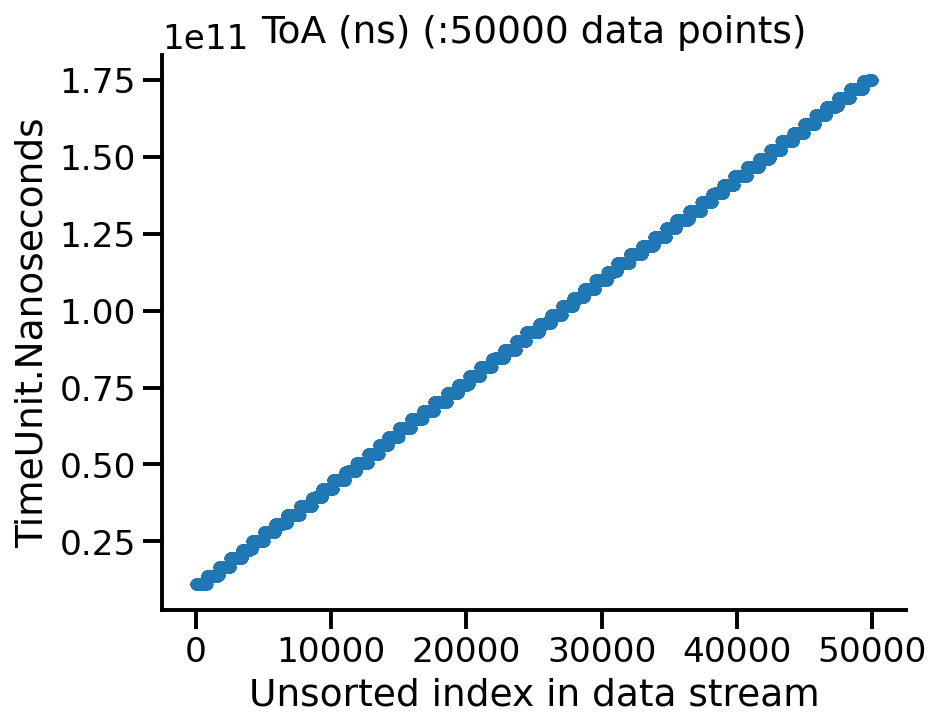
47 plot_toa(pixel_hits, start=0, stop=50000)
Script Output
Example Output
hdf5 datasets: ['ExposureTimeBoundaries', 'PixelHits']
            toa  cid  tot  dtoa    x    y  tof
0  1.103455e+10   -1  150    -1  143  193   -1
1  1.103455e+10   -1  200    -1  140  193   -1
2  1.103459e+10   -1  850    -1   67   92   -1
3  1.103459e+10   -1  300    -1   68   91   -1
4  1.103459e+10   -1  150    -1   67   91   -1
Plot saved to "/Users/Ciaran/atlassian-bitbucket-pipelines-runner/temp/e71169e4-520a-5b30-a5ab-ee8a44eb5fac/build/docs/source/_static/examples_output/plots/ex11_toa_0-50.png"
Plot saved to "/Users/Ciaran/atlassian-bitbucket-pipelines-runner/temp/e71169e4-520a-5b30-a5ab-ee8a44eb5fac/build/docs/source/_static/examples_output/plots/ex11_toa_0-500.png"
Plot saved to "/Users/Ciaran/atlassian-bitbucket-pipelines-runner/temp/e71169e4-520a-5b30-a5ab-ee8a44eb5fac/build/docs/source/_static/examples_output/plots/ex11_toa_0-5000.png"
Plot saved to "/Users/Ciaran/atlassian-bitbucket-pipelines-runner/temp/e71169e4-520a-5b30-a5ab-ee8a44eb5fac/build/docs/source/_static/examples_output/plots/ex11_toa_0-50000.png"
|
|
|
|