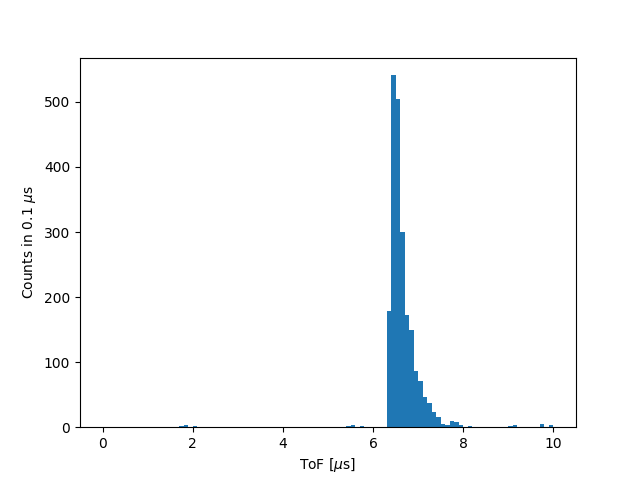
Plot ToF
This example demonstrates how to read the HDF5 output of Luna containing Time of Flight information and plot it using pandas.
Luna Command
./tpx3dump process --input-files /Users/Ciaran/atlassian-bitbucket-pipelines-runner/temp/e71169e4-520a-5b30-a5ab-ee8a44eb5fac/build/docs/source/_static/example_data_with_tdc.tpx3 --output-file /Users/Ciaran/atlassian-bitbucket-pipelines-runner/temp/e71169e4-520a-5b30-a5ab-ee8a44eb5fac/build/docs/source/_static/example_data_with_tdc.h5 --tof-tdc-reference TDC2Rising
Python Script
Python code to read HDF5 data with ToF and plot a simple histogram.
 1import os, sys
 2import h5py
 3import pandas as pd
 4# on our system "EXAMPLE_DATA_WITH_TDC_TPX3" refers to the absolute path
 5# to a hdf5 file generated by luna. Replace with your own!
 6sys.path.append(os.path.abspath(os.path.join(os.path.dirname(__file__), '..')))
 7from env_vars_for_docs_examples import EXAMPLE_DATA_WITH_TDC_HDF5, PLOTS_DIRECTORY
 8
 9
10def load_pixel_hits(hdf5_fname: str) -> pd.DataFrame:
11    """
12    Load pixel hits data from an HDF5 file.
13
14    Parameters:
15    -----------
16    hdf5_fname : str
17        The path to the HDF5 file.
18
19    Returns:
20    --------
21    pd.DataFrame
22        A DataFrame containing the pixel hits data.
23    """
24    with h5py.File(hdf5_fname, 'r') as hdf5_file:
25        print(f"hdf5 datasets: {list(hdf5_file.keys())}")
26        pixel_hits = pd.DataFrame(hdf5_file["PixelHits"][:])
27    return pixel_hits
28
29
30
31if __name__ == "__main__":
32    pixel_hits = load_pixel_hits(EXAMPLE_DATA_WITH_TDC_HDF5)
33
34    # concert 100 fs (units from Luna) to Microseconds [us] as an example
35    pixel_hits["tof"] = pixel_hits["tof"] * (1e2) / (1e8)
36
37    print("Pixel Hits: ")
38    print(pixel_hits.head(15).to_string())
39
40    ax = pixel_hits["tof"].plot.hist(bins=100, range=(0, 10))
41    ax.set_xlabel("ToF [$\mu$s]")
42    ax.set_ylabel("Counts in 0.1 $\mu$s")
43
44    destination = os.path.join(PLOTS_DIRECTORY, "ex16_plot_tof_data.png")
45
46    ax.figure.savefig(destination)
Script Output
Example Output
hdf5 datasets: ['Clusters', 'ExposureTimeBoundaries', 'PixelHits', 'TDCEvents']
Pixel Hits:
             toa  cid   tot    dtoa    x    y       tof
0   356328875000    0  1825       0  108  131  6.484375
1   356328875000    0  1625       0  108  132  6.484375
2   356328875000    0  1300       0  109  131  6.484375
3   356328875000    0  1250       0  109  132  6.484375
4   356328890625    0   925   15625  107  132  6.500000
5   356328890625    0   750   15625  108  130  6.500000
6   356328906250    0   975   31250  107  131  6.515625
7   356328921875    0   700   46875  108  133  6.531250
8   356328937500    0   575   62500  109  130  6.546875
9   356328937500    0   575   62500  109  133  6.546875
10  356328968750    0   475   93750  107  130  6.578125
11  356328984375    0   450  109375  107  133  6.593750
12  356328984375    0   475  109375  110  131  6.593750
13  356328984375    0   450  109375  110  132  6.593750
14  356329093750    0   250  218750  110  130  6.703125
