Time-walk Correction: Apply
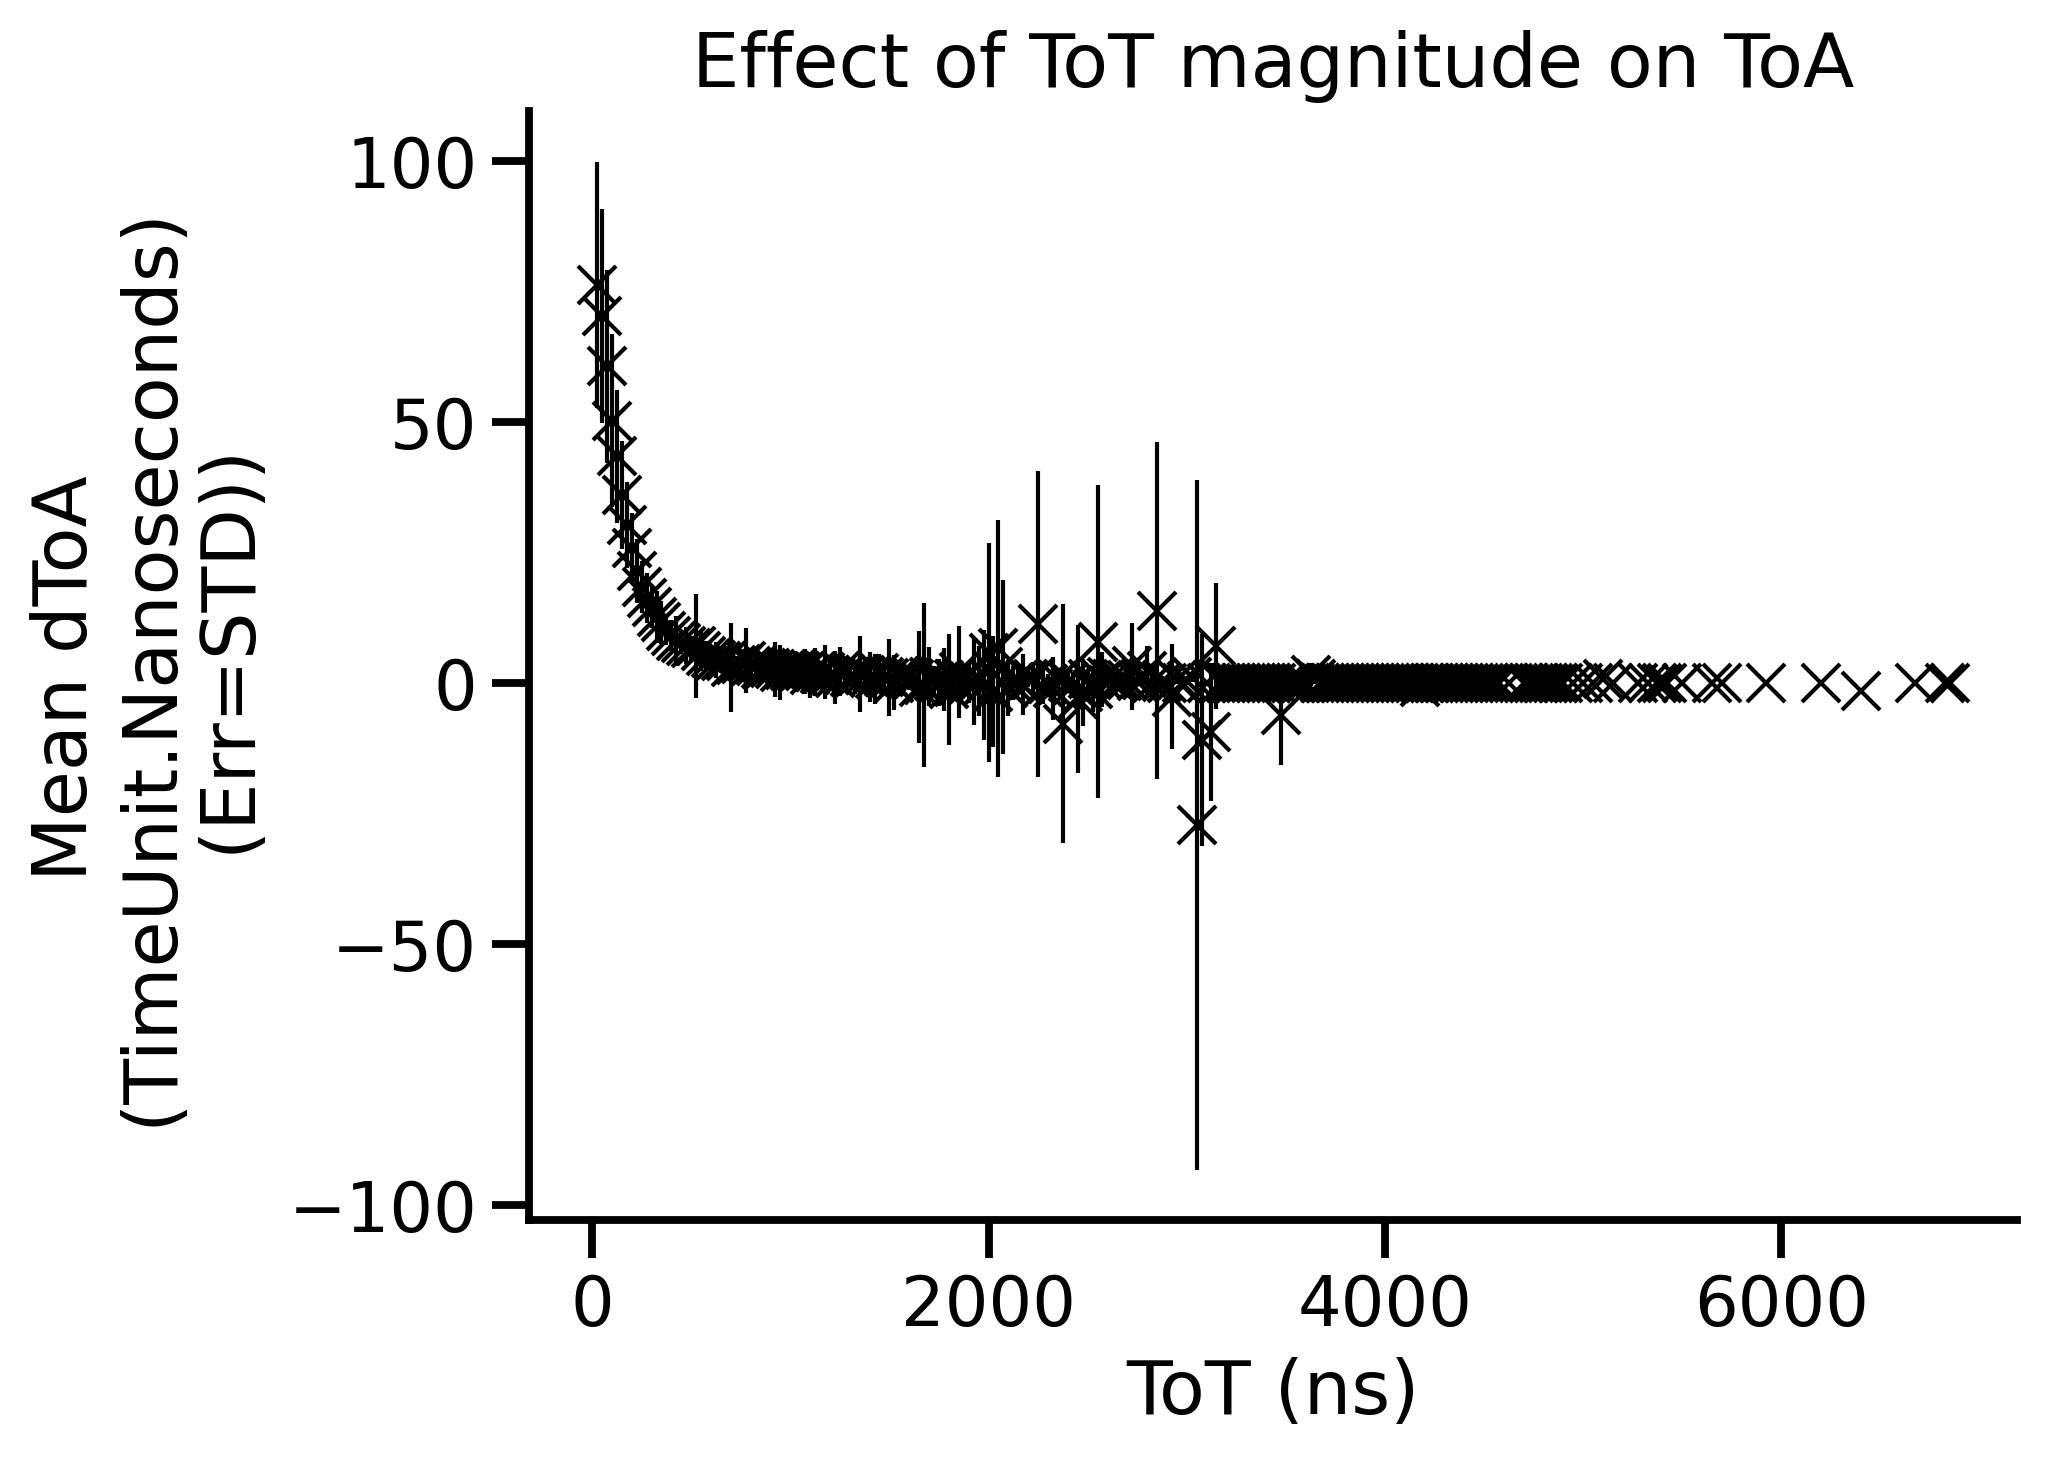
Luna outputs timewalk correction matrix and lookup tables for correcting the ToA based on the magnitude of the ToT and a relationship inferred from your data. That relationship can be examined to refine your curve by adjusting the ctot-cut parameter.
However once you are happy with your lookup table application of the correction is a simple matter of lookup and subtraction.
Luna Command
./tpx3dump process -i /Users/Ciaran/atlassian-bitbucket-pipelines-runner/temp/e71169e4-520a-5b30-a5ab-ee8a44eb5fac/build/docs/source/_static/example_data.tpx3 -o /Users/Ciaran/atlassian-bitbucket-pipelines-runner/temp/e71169e4-520a-5b30-a5ab-ee8a44eb5fac/build/docs/source/_static/example_data.h5 --eps-t 140ns --eps-s 2 --layout single
Python Script
Apply the timewalk correction
 1import os, sys
 2from typing import *
 3import lmfit
 4import pandas as pd  # ensure you have `pip install pandas`
 5import warnings
 6import seaborn as sns
 7import matplotlib.pyplot as plt
 8from matplotlib import cm
 9from matplotlib.colors import Normalize
10
11warnings.filterwarnings("ignore")  # suppress warnings from plotting libraries.
12
13sns.set_context(context="talk")
14
15# add some paths to PYTHONPATH
16for directory in ["..", "."]:
17    sys.path.append(os.path.abspath(os.path.join(os.path.dirname(__file__), directory)))
18
19# on our system "EXAMPLE_DATA_HDF5" refers to the absolute path
20# to a hdf5 file generated by luna. Replace with your own!
21from env_vars_for_docs_examples import EXAMPLE_DATA_HDF5, PLOTS_DIRECTORY
22
23# re-use functions from previous example
24from ex2_read_data_time_units import load_pixel_hits, load_timewalk_lookup_table, TimeUnit
25
26
27def apply_timewalk_correction(pixel_data: pd.DataFrame, timewalk_lut: pd.DataFrame):
28    """Takes the timewalk look up table (LUT) that was calculated by luna (using some
29    ctot-cut parameter x) and uses it to correct ToA for timewalk effects
30    """
31    pixel_data["corrected_toa"] = pixel_data["toa"] - pixel_data["tot"].map(timewalk_lut["AverageDToA"])
32    return pixel_data
33
34
35def plot_lookup_table(timewalk_lut: pd.DataFrame, toa_unit: TimeUnit):
36    """Plot a scatter graph with error bars (Std) of the timewakl lookup table"""
37    fig = plt.figure()
38    print(timewalk_lut)
39    timewalk_lut = timewalk_lut.dropna(subset=["AverageDToA", "Std"])
40    plt.errorbar(timewalk_lut.index, timewalk_lut["AverageDToA"], yerr=timewalk_lut["Std"],
41                 marker="x", color="black", linewidth=1, linestyle="None" )
42    plt.xlabel("ToT (ns)")
43    plt.ylabel(f"Mean dToA \n({toa_unit})\n (Err=STD))")
44    plt.title("Effect of ToT magnitude on ToA")
45
46    sns.despine(fig=fig)
47
48    fname = os.path.join(PLOTS_DIRECTORY, f"ex7_correct_toa_for_timewalk.png")
49    plt.savefig(fname, bbox_inches="tight", dpi=300)
50
51
52if __name__ == "__main__":
53    toa_unit = TimeUnit.Nanoseconds
54    pixel_data: pd.DataFrame = load_pixel_hits(EXAMPLE_DATA_HDF5, toa_unit)
55    timewalk_lut: Optional[pd.DataFrame] = load_timewalk_lookup_table(EXAMPLE_DATA_HDF5, toa_unit)
56
57    if timewalk_lut is not None:
58        pixel_data = apply_timewalk_correction(pixel_data=pixel_data, timewalk_lut=timewalk_lut)
59
60        plot_lookup_table(timewalk_lut=timewalk_lut, toa_unit=toa_unit)
61
62        print("Timewalk corrected ToA's")
63        print(pixel_data.head(15).to_string())
Script Output
Example Output
hdf5 datasets: ['Clusters', 'ExposureTimeBoundaries', 'PixelHits']

Note
Since we are (necessarily) using a small tpx3 file for the examples there is some instability between the ToT=2000ns - 4000ns. This is because the time walk lookup table is inferred directly from your data and since this dataset is minimal there may not be enough data to fully inform the timewalk matrix.